
Publications
Statistical Predictions of the Accreted Stellar Halos around Milky Way-Like Galaxies
submitted 2026
In the ΛCDM paradigm, stellar halos form through the accretion and disruption of satellite galaxies. We introduce new semi-analytic modeling within the SatGen framework to track the ex-situ stellar components of Milky Way–like galaxies across large ensembles of merger trees, enabling a statistical study of the stochastic nature of galaxy assembly. We find that accreted stellar halos are typically built by only a few progenitors and are highly sensitive to the fate of the most massive satellite, producing order-of-magnitude variations in accreted stellar halo mass even at fixed host halo mass. Different stellar components trace distinct phases of host halo growth: central and accreted stellar mass correlate most strongly with early assembly, while surviving satellites trace more recent accretion. Finally, using Random Forest Regression, we quantify how well observable galaxy properties can recover halo assembly histories, providing a framework for interpreting upcoming low-surface-brightness observations of stellar halos. Read the paper here
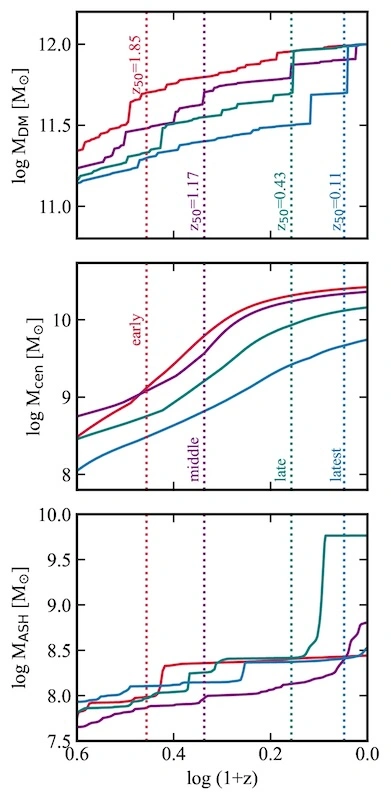
The mass accretion histories (MAHs) of the four illustrative example MW-like galaxies. Top panel: The host halo evolution with corresponding formation times. Notice there is significant variance across the four examples despite them all having the same present-day mass. Second panel: The central galaxy evolution which is dominated by in-situ star formation. Notice that the earliest forming galaxy has the largest present-day stellar mass. Notice the relative smoothness in the growth of the stellar mass of the central component compared to the step-like increase of the mass of the dark matter halo. This is a consequence of the fact that the build-up of stellar mass involves an integration of the star formation rate across cosmic time. Third panel: The accreted stellar halo evolution whose which are a convolution of the dark matter MAHs and the subsequent satellite orbit evolution.
Constraining the Low Mass End of the Stellar Halo Mass Relation with Surveys of Satellite Galaxies
ApJ, 2024
The abundance of satellite galaxies is set by the hierarchical assembly of their host halo. We leverage this to investigate the low mass end of the Stellar-to-Halo Mass Relation (SHMR), which is key to constraining theories of galaxy formation and cosmology. We argue that recent analyses of satellite galaxies in the Local Group environment have not adequately modelled the dominant source of scatter in satellite stellar mass functions: the variance in accretion histories for a fixed host halo mass. We present a novel inference framework that not only properly accounts for this halo-to-halo variance but also naturally identifies the amount of host halo mass mixing, which is generally unknown. Specifically, we use the semi-analytical SatGen model to construct mock satellite galaxy populations consistent with the third data release of the Satellites Around Galactic Analogs (SAGA) survey. We demonstrate that even under the most idealized circumstances, the halo-to-halo variance makes it virtually impossible to put any meaningful constraints on the scatter in the SHMR. Even a satellite galaxy survey made up 100 hosts can at best only place an upper limit of ∼ 0.5dex on the scatter (at the 95% confidence level). This is because the large variance in halo assembly histories dominates over the scatter in the SHMR. This problem can be overcome by increasing the sample size of the survey by an order of magnitude (∼ 1000 host galaxies), something that should be fairly straightforward with forthcoming spectroscopic surveys. Read the paper here
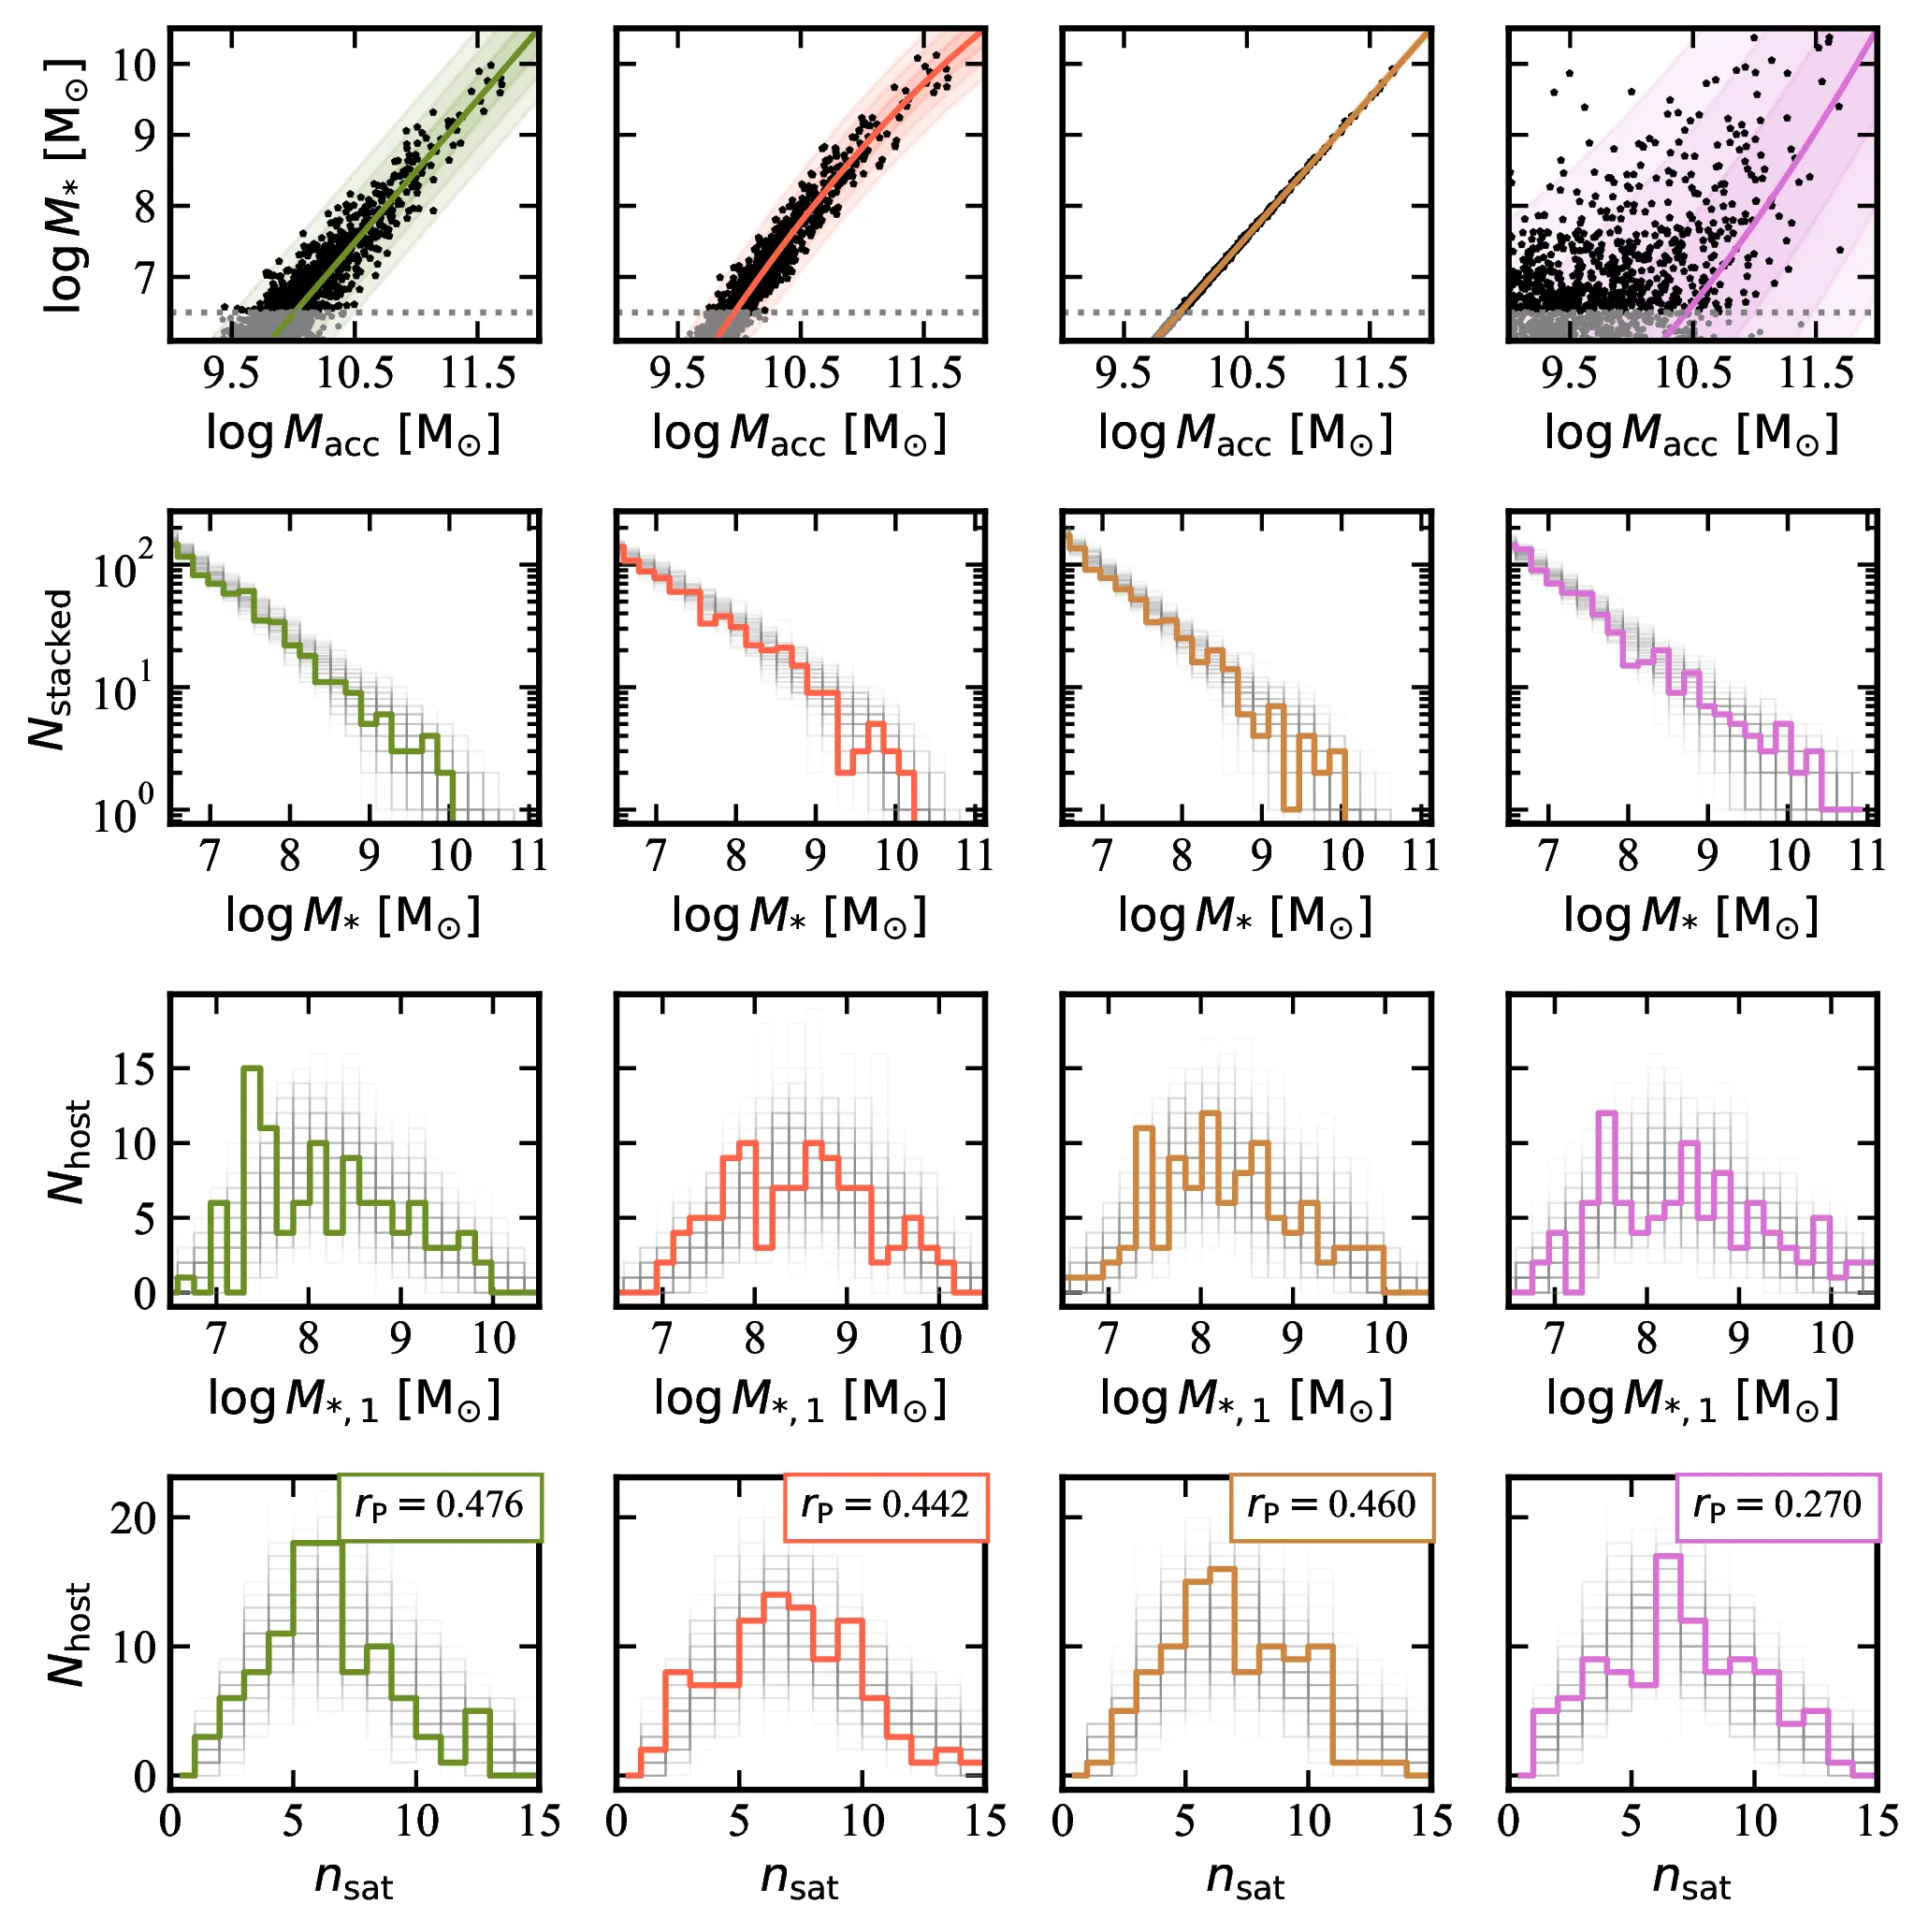
An illustrative selection of four wildly different SHMRs and their associated summary statistics. The top rows show the actual SHMR (solid lines), and a single mock SAGA survey realization (black asterisks). The second row shows the corresponding “stacked” Satellte Stellar Mass Functions (SSMFs) as thick colored line. The third and bottom rows shows histograms of the most massive satellite per host and the total number of satellites per host respectively. In the background of the bottom three rows we show the “SAGA-to-SAGA” variance in these summary statistics as thin grey lines. Despite the wildly different SHMRs, these four mock SAGA surveys are virtually indistinguishable in terms of their summary statistics. This means it will be difficult to place meaningful constraints on the SHMR with a SAGA-like survey. You can play around with different parametrizations of the SHMR using this steamlit webapp I designed!
The Mid-infrared Molecular Inventory toward Orion IRc2
ApJ, 2023
We present the first high spectral resolution mid-infrared survey in the Orion BN/KL region, covering 7.2–28.3 μm. With SOFIA/EXES, we target the enigmatic source Orion IRc2. While this is in the most prolifically studied massive star-forming region, longer wavelengths and molecular emission lines dominated previous spectral surveys. The mid-infrared observations in this work access different components and molecular species in unprecedented detail. We unambiguously identify two new kinematic components, both chemically rich with multiple molecular absorption lines. The “blue clump” has v LSR = ‑7.1 ± 0.7 km s‑1, and the “red clump” has 1.4 ± 0.5 km s‑1. While the blue and red clumps have similar temperatures and line widths, molecular species in the blue clump have higher column densities. They are both likely linked to pure rotational H2 emission also covered by this survey. This work provides evidence for the scenario that the blue and red clumps are distinct components unrelated to the classic components in the Orion BN/KL region. Comparison to spectroscopic surveys toward other infrared targets in the region show that the blue clump is clearly extended. We analyze, compare, and present in-depth findings on the physical conditions of C2H2, 13CCH2, CH4, CS, H2O, HCN, H13CN, HNC, NH3, and SO2 absorption lines and an H2 emission line associated with the blue and red clumps. We also provide limited analysis of H2O and SiO molecular emission lines toward Orion IRc2 and the atomic forbidden transitions [Fe II], [S I], [S III], and [Ne II]. Read the full paper here
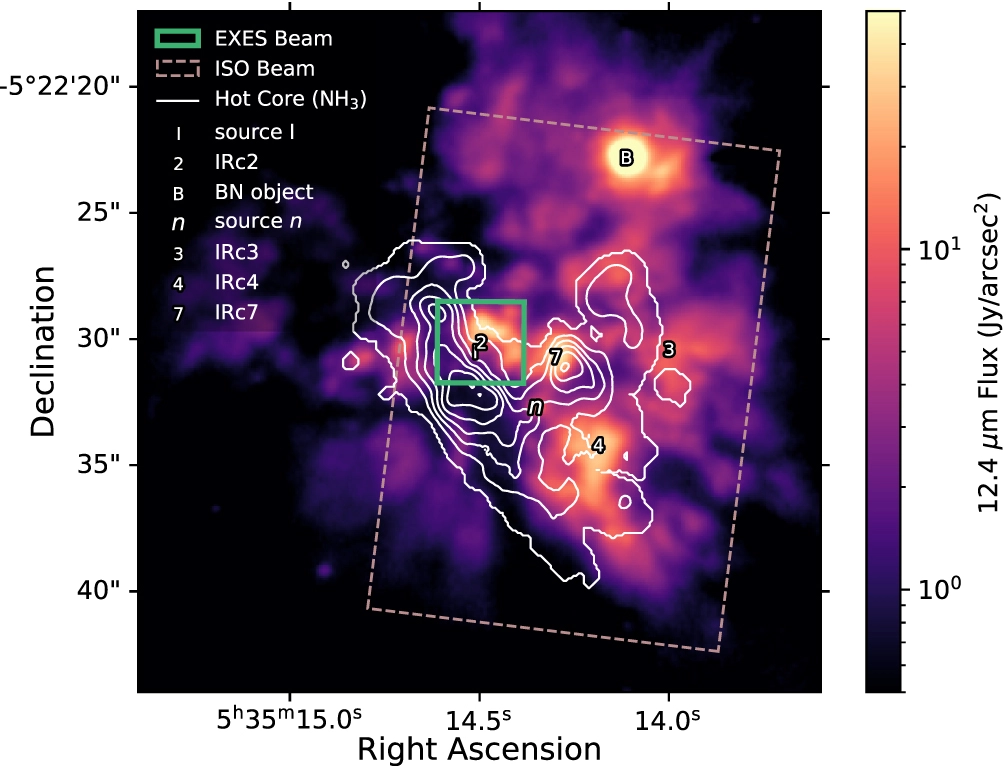
Mid-infrared (MIR) image of the Orion BN/KL region. The color map is the 12.4 μm flux (SUBARU/COMICS; Okumura et al. 2011). White contours are the hot core traced by the NH3 inversion transition (J, K) = (7, 7) (NRAO/EVLA; Goddi et al. 2011), and each level is 75 mJy beam−1 km s−1. The thick green box is the EXES beam for the 7.6a μm setting. The dashed brown box is the smallest beam used in the Infrared Space Observatory (ISO) survey (van Dishoeck et al. 1998). Symbols refer to regional features discussed in this work. The position of “2” for IRc2 is at the EXES beam center for all settings in this survey. The location of BN is from Gomez et al. (2005). All other symbols, source I, source n, IRc3, IRc4, and IRc7, are placed according to Okumura et al. (2011).
Effective Opacity of the Intergalactic Medium from Galaxy Spectra Analysis
ApJ, 2021
We measure the effective opacity (τeff) of the intergalactic medium from the composite spectra of 281 Lyman-break galaxies in the redshift range 2 ≲ z ≲ 3. Our spectra are taken from the COSMOS Lyα Mapping And Tomographic Observations survey derived from the Low Resolution Imaging Spectrometer on the W.M. Keck I telescope. We generate composite spectra in two redshift intervals and fit them with spectral energy distribution (SED) models composed of simple stellar populations. Extrapolating these SED models into the Lyα forest, we measure the effective Lyα opacity ( τeff) in the 2.02 ≤ z ≤ 2.44 range. At z = 2.22, we estimate τeff=0.159±0.001from a power-law fit to the data. These measurements are consistent with estimates from quasar analyses at z < 2.5 indicating that the systematic errors associated with normalizing quasar continua are not substantial. We provide a Gaussian processes model of our results and previous τeff measurements that describes the steep redshift evolution in τeff from z = 1.5-4. Read the full paper here
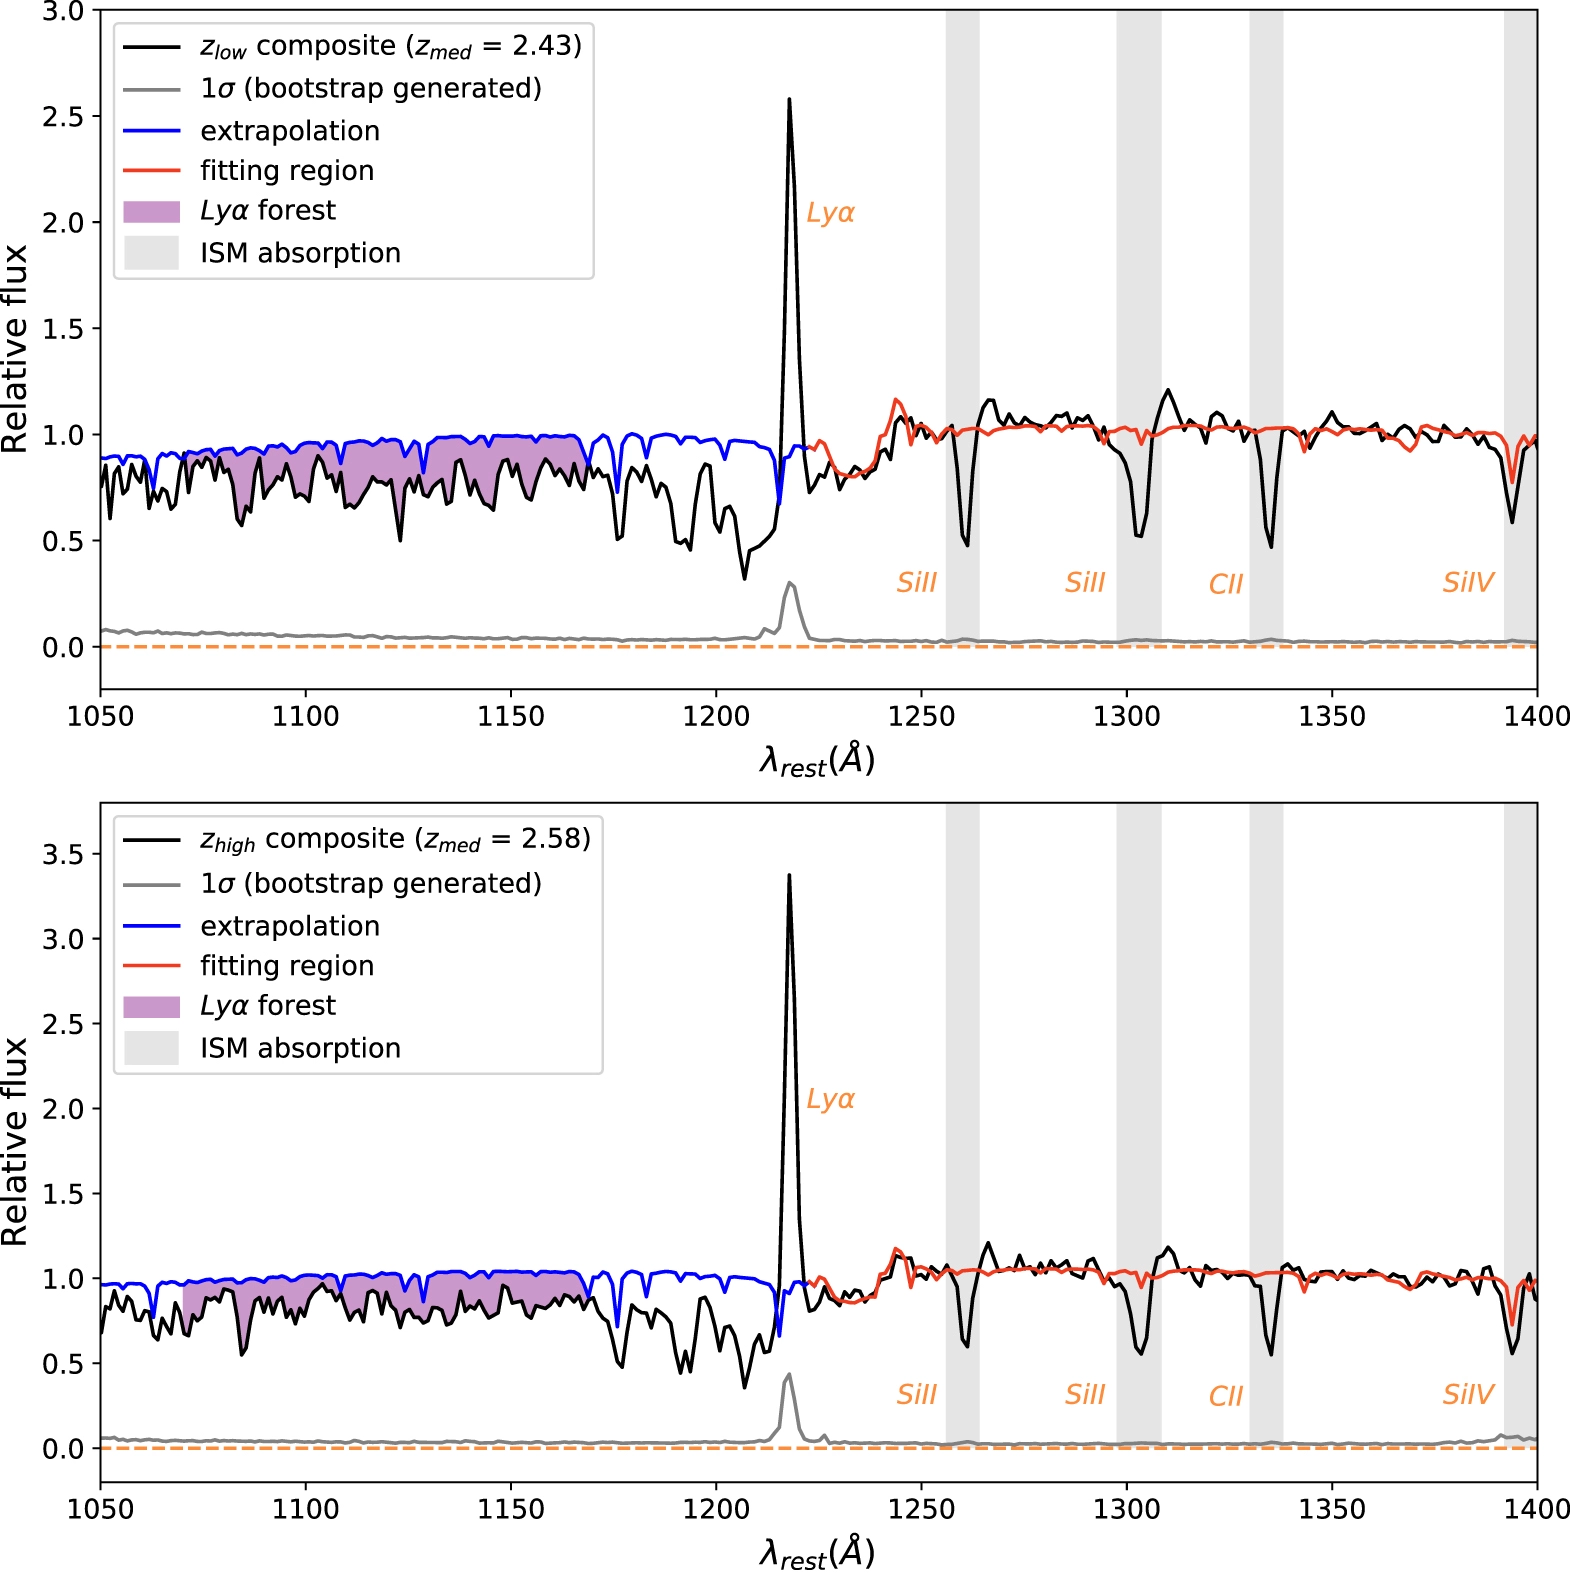
Two composite or “stacked” CLAMATO spectra and their corresponding SED fits. The SED fits are two-toned, showing the region in which the fit is constrained by our data (red) and where the fit is extrapolated to measure the forest (blue). The excess flux in the model, blueward of Lyα, is caused by HI attenuation from the IGM. This excess is what we use to measure the effective opacity. The error spectrum is based on the bootstrap matrix and is plotted in gray. Some of the most prominent ISM transitions are denoted by gray bands and are not included in the fitting.